Color Vision Deficiency (CVD), also known as color blindness, affects nearly 8% of genetic males and 0.5% of genetic females. This condition hinders individuals’ ability to discern between specific colors, making it challenging to visually process data. In fields such as meteorology, where colors are used to convey critical information, CVD poses a significant obstacle for professionals working in the industry.
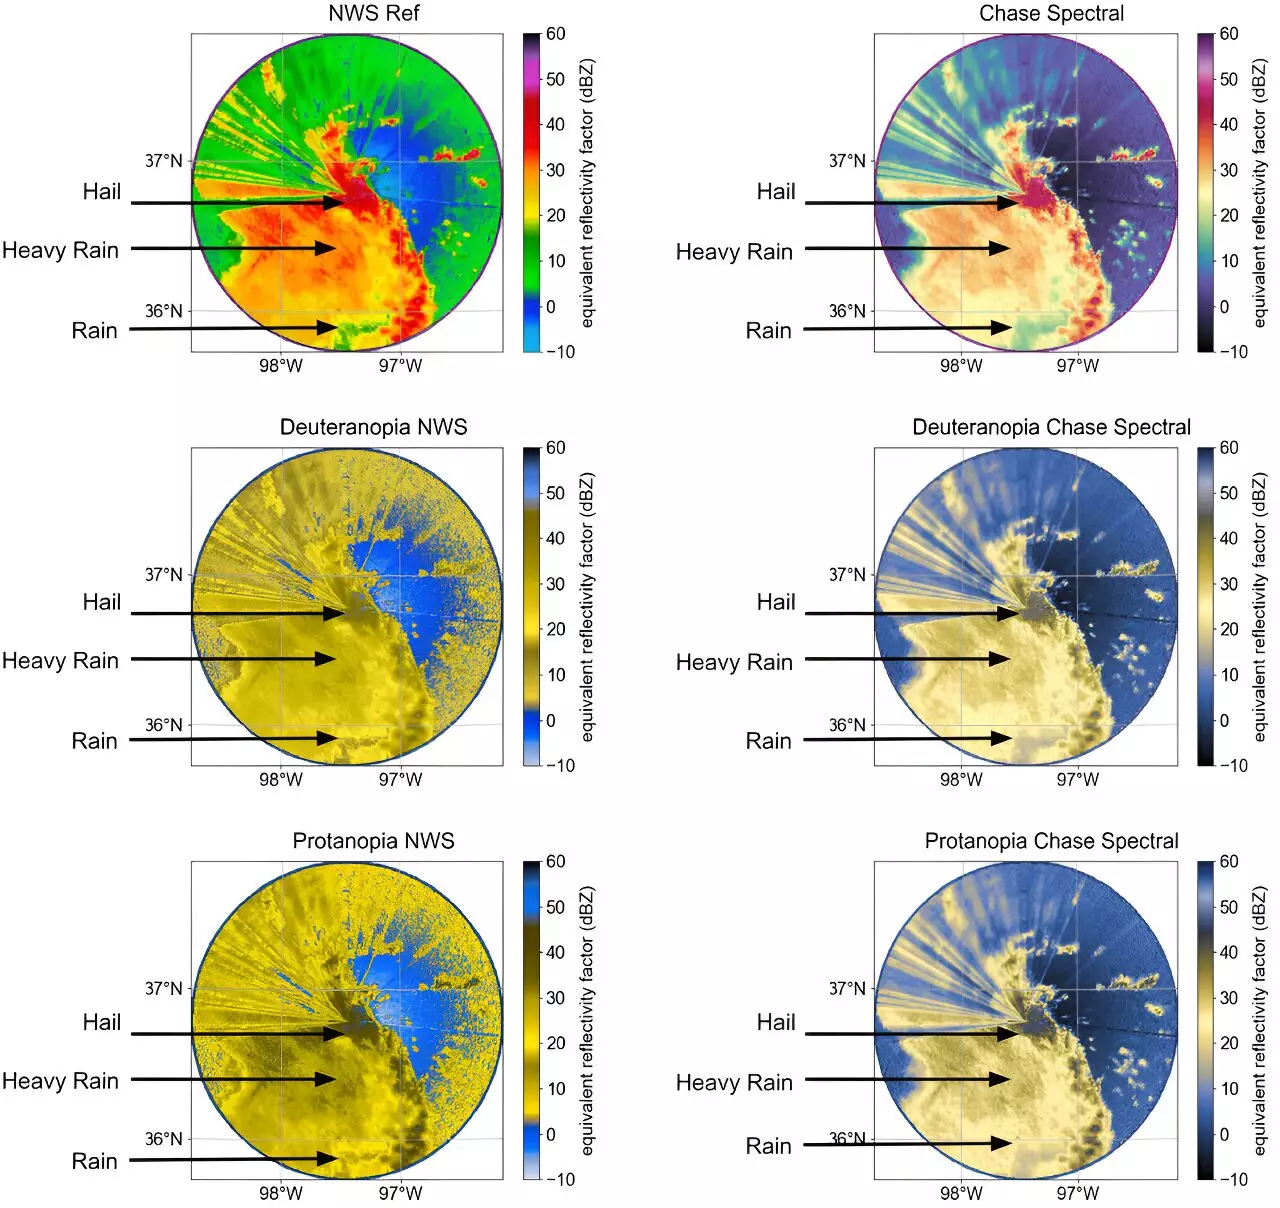
Many scientists in the weather radar community have CVD, which complicates the interpretation of radar reflectivity and storm intensity. Traditional colormaps used in weather radar maps often fail to consider individuals with CVD. For instance, some colormaps display colors like red and green close to each other, making it difficult for those with CVD to differentiate between various types of precipitation and convection.
Researchers at the U.S. Department of Energy’s (DOE) Argonne National Laboratory have recognized the importance of creating CVD-friendly colormaps to enhance the accessibility and interpretability of weather radar data. In a recent study published in the Bulletin of the American Meteorological Society, scientists detailed their work on developing colormaps that cater to individuals with CVD while highlighting essential characteristics of clouds and precipitation.
The researchers at Argonne National Laboratory utilized Python programming language tools to design CVD-friendly colormaps for radar reflectivity (Ze) and storm velocity data. By assigning distinct colors to different weather phenomena, such as drizzle, rain, and hail, the researchers aimed to create colormaps that were not only accessible to individuals with CVD but also beneficial for the radar community as a whole.
The newly developed CVD-friendly colormaps were subjected to rigorous testing and evaluation to ensure their effectiveness. The colormaps were shared with the CVD community for feedback, and radar researchers unanimously agreed that the new colormaps were more interpretable compared to the default colormaps currently in use. This collaborative approach to developing inclusive colormaps highlights the importance of community engagement in enhancing scientific visualization practices.
The introduction of CVD-friendly colormaps in meteorology not only benefits professionals in the radar community but also has a broader impact on inclusivity and accessibility in scientific visualization. By adopting these colormaps, future meteorologists will be equipped with tools that promote equitable data interpretation and communication. As the research team continues to expand their library of CVD-friendly colormaps, they aim to establish a global community practice that prioritizes inclusivity and diversity in meteorological visual science.
Overall, the development of CVD-friendly colormaps represents a significant step towards creating a more inclusive and accessible environment in meteorology. By prioritizing the needs of individuals with color vision deficiency, researchers are reshaping the landscape of scientific visualization and paving the way for a more inclusive future in the field of meteorology.
Leave a Reply